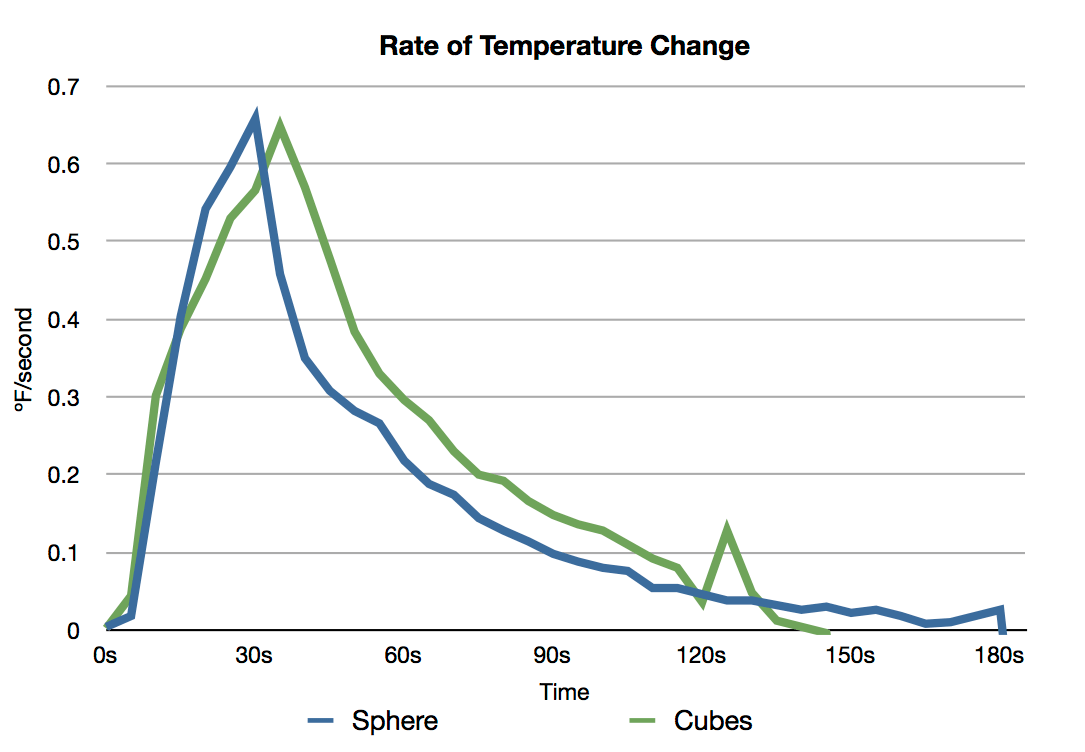
The rate of cooling over time for ice cubes and an ice sphere. Note: the noisy data for cubes was the result of a slight repositioning of the temperature probe.
Using the temperature data collected, the 5 second average rate of cooling was computed for both an ice sphere and a comparable mass of ice cubes.
