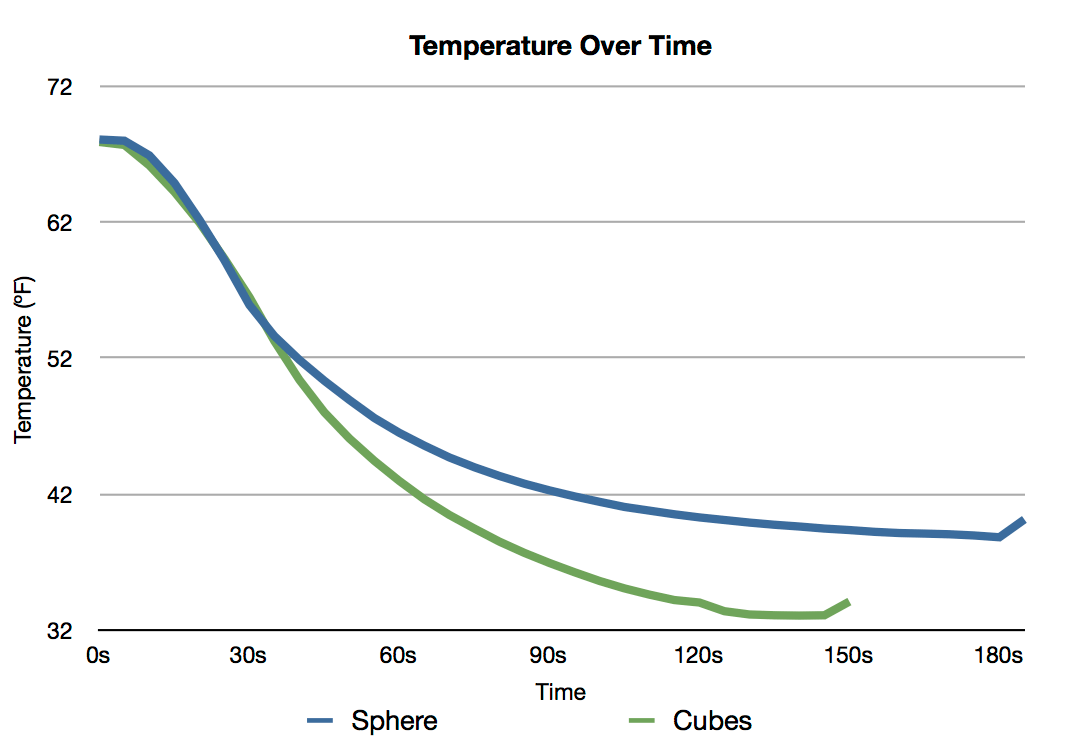
Temperature (ºF) of two glasses of Bourbon, one cooled using a sphere of ice, the other using five (5) ice cubes.
During the experiment, two glasses of bourbon were poured, one with a single large sphere of ice, the other with five ice cubes, such that each glass contained a comparable mass of ice. The temperature was then measured ever half second and 5 second averages of those measurements were taken. This graph shows those 5 second average over the course of cooling each glass.
