For some reason, we ended up with a large number of chicken breasts in the house over the weekend. Not to waste the opportunity, we did additional science to them.
Initial observation: There are a large number of varieties and brands of chicken breasts for sale in the market.
Question: Is there are distinct qualitative difference between different brands of chicken breast, and how does breast density or mass affect cooking time?
Expectation: Some difference is expected in the qualitative test, especially between the frozen, saline-augmented, breasts and the “all natural” varieties.
Equipment & Materials:
- several types of chicken breasts (here is a picture of the brands/varieties used)
- metal sheet pan + rack
- oven
- instant read thermometer
- desired flavoring agents (we used a bicentennial blend from The Spice House in Milwaukee)
- a hunger
Procedure:
- mass all breasts
- optional, determine density by finding the volume using the methods described here
- determine initial internal temperature of all breasts
- place chicken-laden sheet pans into an oven that has been preheated to 350°F
- check internal temperature at various times in the cooking process (I made readings at 15, 25, 30, 35, 45 minutes)
- to avoid overly cooling the oven, the sheet pan was removed and rested on the stove top as temperatures were measured.
- remove chicken breasts that reach 160°F (USDA recommends 165°F, but possessing a functioning immune system I ignore that)
- place finished breasts in a covered container to rest & finish carryover (see here , note that carryover will be minimal for small masses like chicken breasts, but e. coli dies at 160°F, and salmonella, which is most likely to be on the surface of the meat if it is there, dies after 12 minutes of exposure at 140° F)
- mass breasts after cooking to examine mass-loss
- have dinner
Data:
| Breast Type | Pre-cooked Mass (g) | density (g/cc) | °rise/min | % mass loss after cooking |
| Natural | 165 | 1.71 | 2.91 |
11 |
| 165.9 | 1.66 | 2.88 |
9 |
|
| 173.4 | 1.27 | 2.81 |
10 |
|
| Amish | 166.0 | 1.4 | 3.01 |
11 |
| 156.7 | 1.55 | 4.46 |
8 |
|
| 139.3 | 1.43 | 3.44 |
11 |
|
| Frozen-augmented | 416.7 | 1.11 | 2.52 |
17 |
| 309.5 | 1.18 | 3.81 |
14 |
|
| 289.6 | 1.3 | 3.25 |
17 |
The °rise/min for the Natural breasts is very consistent, however, their size was also the most consistent of the 3 types. The Frozen breasts that contain “up to 21% solution” suffered the most mass loss during cooking. Note that the 17% mass loss from the 416.7g breast is over half the initial mass of the smallest breast in the experiment!. Density was quite variable between the breasts, with the frozen-augmented breasts having the lowest density as a group.
If the density of the muscle is assumed to be 1.06 g/cc, as utilized in this study, and the density of a 4% saline solution (back of envelope calculation using information from the nutritional statement here) is 1.03 g/cc, it makes sense that the frozen-augmented breasts would have a lower density. Note that all our calculated densities are significantly higher than both of these values, which may be due to measurement accuracy issues.
According to this paper, male chickens tended to have a 16% greater myofiber density in the breast than the females, so some of the density variation may be due to different genders being represented in the sample. Note that broiler chicken breeds are raised for their meat, so both male and female chickens are butchered.
Taste test observations:
- All Natural: stereotypical chicken, nice meaty texture & flavor
- Amish: texturally quite different than the All Natural. Smoother, softer textured meat, but good flavor
- Frozen-Augmented: almost no discernible texture to the meat, very salty
Taste-test winner: The All Natural, run-of the mill refrigerated chicken breasts. In this case “stereotypical” chicken flavor and texture was a good thing.
Conclusion:
The frozen breasts are freakishly large, have a strange non-texture, and are very salty (“holy salt batman!” was exclaimed during the taste-testing). It is assumed that the significant additional mass loss during cooking is due to the added saline solution. This product has a convenience factor going for it, but should likely be considered an ingredient rather than the star protein of a meal.
Temperature trends are considered suspect due to heat loss from continual opening of the oven, and chilling of the breasts as temperatures were being measured.
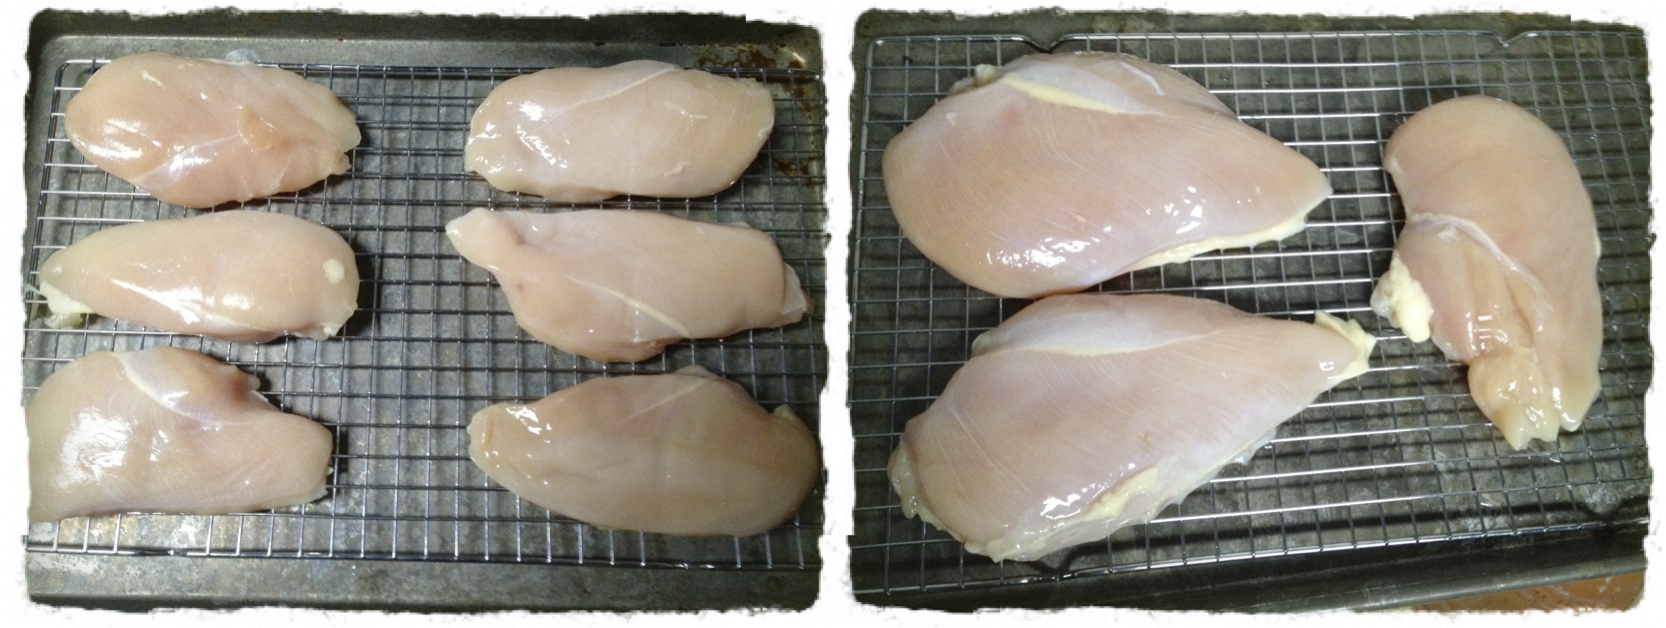
Left: The ‘All Natural’ (left) and ‘Amish’ (right) breasts on a gridded cooling rack. Right: the ‘Frozen-augmented’ breasts that have been thawed, set on an identical cooling rack. Note the significant size difference.
Future Questions:
How does truly fresh, local, natural chicken compare against the grocery store varieties?
Can cooking temperature trends be better resolved with internal temperature probes + continual reading (rather than having to continually open the oven to use the instant read thermometer)?
